📖 Cam Designer User Documentation
Getting Started
Welcome to Cam Designer! This comprehensive tool allows you to design and analyze valve train systems with detailed geometric calculations and performance visualization.
System Requirements
- Modern web browser (Chrome, Firefox, Safari, Edge)
- JavaScript enabled
- Display resolution: 1024×768 or higher recommended
📈 Understanding Motion Curves
When you design a cam profile in Cam Designer, the software displays four curves on the Motion Design graph: Lift, Velocity, Acceleration, and Jerk. These four curves are not independent — each one is derived from the one before it. Together, they give you a complete picture of how a valve (or any follower) moves as the cam rotates.
This section explains what each curve means, why it matters, and how to read them — even if you've never worked with calculus or motion analysis before.
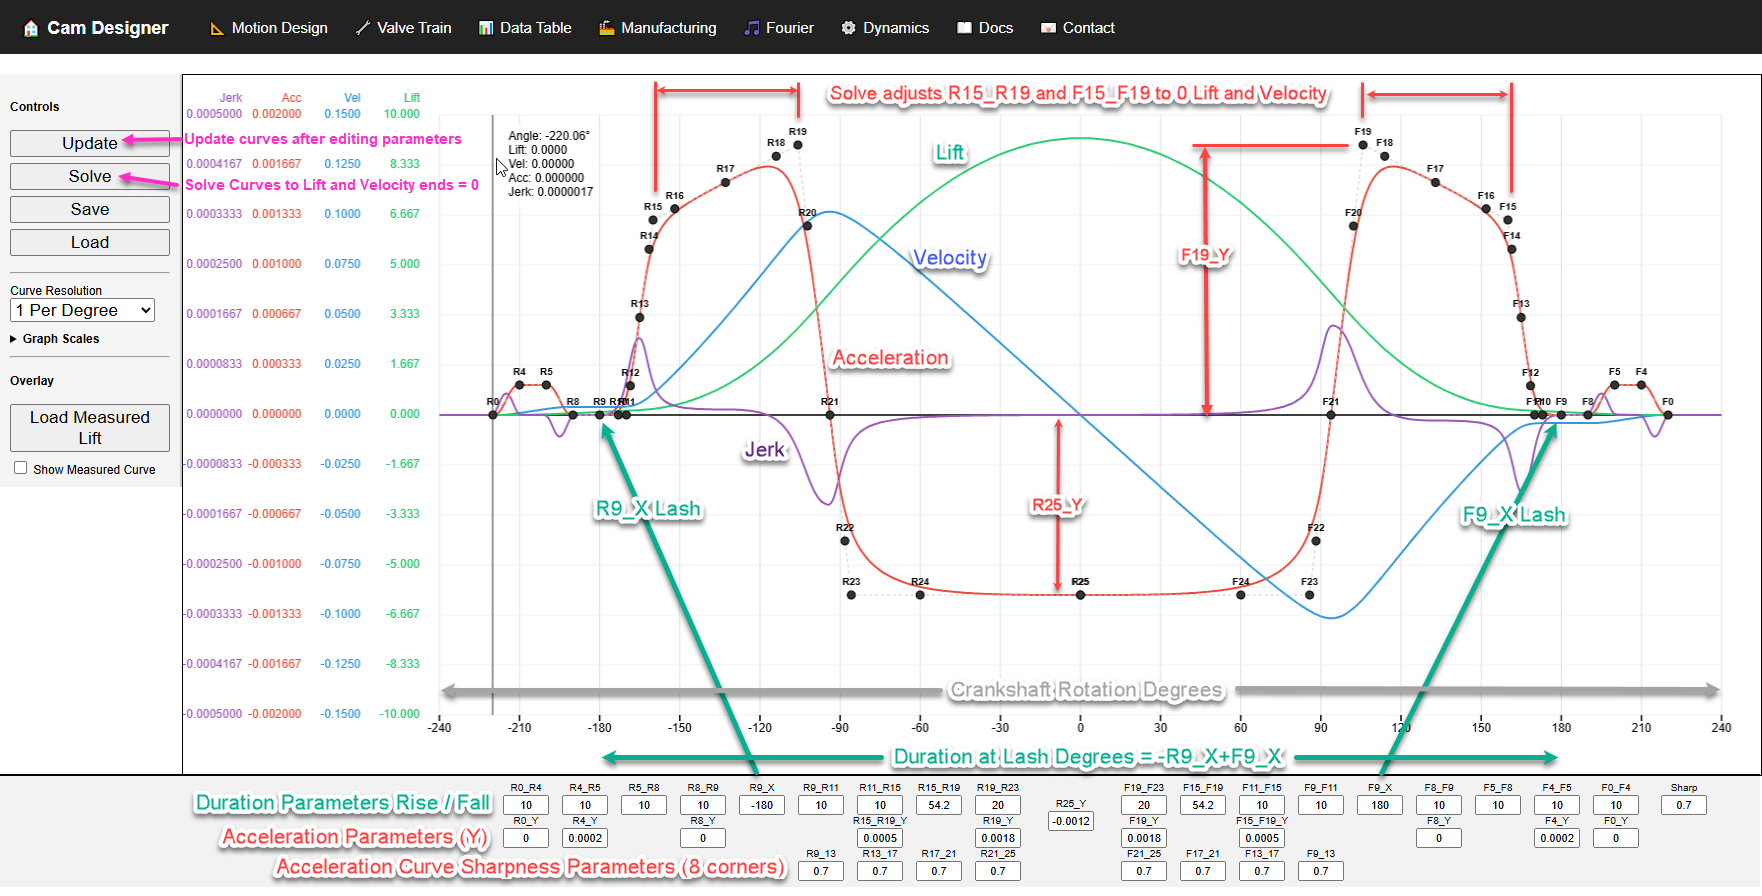
Designing Your Motion Profile
The annotated image above shows the Motion Design page — where all cam profile design happens. Before diving into the theory behind each curve, here is how the software works and how to use it effectively.
Reading the Graph
The horizontal axis represents cam rotation in degrees. Zero degrees is at the point of maximum lift (the nose of the cam). Negative angles are the rise side (valve opening) and positive angles are the fall side (valve closing). The numbers along the baseline are crank rotation degrees.
Because the four curves have very different magnitudes — lift might be 10 mm while acceleration is 0.002 mm/deg² — each curve has its own scale. The scale legends are shown on the left side of the graph, and you can adjust each one independently using the Graph Scales dropdown in the left panel.
The Control Panel
Below the graph, the control panel has three rows of input fields arranged in two groups — Rise (left) and Fall (right) — with a center column at 0°. The small nodes visible on the acceleration curve are the control points that correspond to these input fields:
- X values (top row): The angular duration of each acceleration segment in degrees. These control how wide each section of the acceleration curve is.
- Y values (middle row): The acceleration magnitude at key control points. These control the height of the acceleration peaks and valleys.
- Sharpness values (bottom row): How rounded the corners are between acceleration segments. Values near 0 produce very round transitions (lower jerk); values near 1 produce sharp corners (higher jerk but more area under the curve, which means more lift for a given duration). The global Sharp field sets a default that individual corner values can override.
The duration at lash — the total angular width of the cam event — is the sum of
all X-row values on each side. The angular separation between the rise and fall ramp ends is
defined by −R9_X + F9_X.
The Design Workflow: Update and Solve
After editing parameter fields, use the two buttons in the left panel to recalculate the profile:
- Update — Recalculates all four curves from your current parameters. This is a quick preview that shows you exactly what your values produce, with no automatic corrections. Use it after every edit to see the immediate effect.
- Solve — Recalculates the curves and automatically adjusts the profile so that both lift and velocity equal exactly zero at the ends of the cam event. This enforces the closure constraint, ensuring the follower returns precisely to the base circle with zero seating velocity.
Save, Load, and Export Lift
All files are saved to and loaded from your local computer using your browser's standard download and file-picker dialogs. Nothing is stored on the server.
- Save — Downloads a
.jsonfile containing all of your current design parameters (every value in the control panel). Use this to preserve a design so you can come back to it later. - Load — Opens a file picker so you can select a previously saved design file. The parameters are loaded into the control panel; press Update to recalculate the profile.
- Export Lift — Downloads a
.jsonfile containing the computed lift-vs-crank-angle table. This file can be loaded on the Flow Analysis page to analyze curtain area and breathing.
C:\CamDesigns\
  ├── Designs\          ← Saved design parameter files (.json from Motion Design → Save)
  ├── LiftProfiles\     ← Exported lift profile files (.json from Motion Design → Export Lift)
└── FlowConfigs\ ← Flow analysis configurations (.json from Flow Analysis → Save)The Big Picture: Position → Speed → Force → Shock
Think of the four curves as answering four increasingly detailed questions about the follower's motion:
| Curve | Question It Answers | Everyday Example |
|---|---|---|
| Lift | Where is the follower right now? | Your car's odometer — how far have you gone? |
| Velocity | How fast is the follower moving? | Your speedometer — how fast are you going? |
| Acceleration | How quickly is the speed changing? | The push you feel when the driver hits the gas or brakes. |
| Jerk | How suddenly does the push change? | The jolt when someone stomps on the brakes versus squeezing them smoothly. |
Lift (Displacement)
What It Is
Lift is the most intuitive curve. It shows how far the follower has moved away from the base circle at each angle of cam rotation. When lift is zero, the follower is sitting on the base circle and the valve is closed. At maximum lift, the valve is fully open.
What to Look For
- Maximum lift — the peak of the curve tells you how far the valve opens.
- Duration — the width of the curve (in degrees) tells you how long the valve is open.
- Symmetry — an asymmetric profile (different rise and fall shapes) is normal and often intentional.
- Smoothness — the lift curve should be a smooth, continuous arc. Any kink or flat spot indicates a problem in the motion definition.
Velocity
What It Is
Velocity is the rate of change of lift. It tells you how fast the follower is moving at each point. Mathematically, velocity is the first derivative of lift with respect to cam angle.
When velocity is positive, the follower is moving upward (valve opening). When velocity is negative, the follower is moving downward (valve closing). When velocity is zero, the follower is momentarily stopped — this happens at the base circle and at maximum lift (the follower has to stop before reversing direction).
How to Read It
- Steep lift = high velocity: Wherever the lift curve is climbing steeply, the velocity curve will show a high value.
- Flat lift = zero velocity: At the peak of the lift curve and on the base circle, velocity is zero.
- Velocity crossing zero: This moment is the maximum lift point — the follower stops rising and begins to descend.
Why It Matters
In an engine, the velocity of the follower determines the oil flow rate through the valve opening and affects how quickly the valve clears the seat. Very high velocity at the seating point (when the valve closes) causes the valve to slam into the seat, leading to excessive noise, seat wear, and potential valve failure.
Acceleration
What It Is
Acceleration is the rate of change of velocity — the second derivative of lift. It tells you how quickly the follower is speeding up or slowing down.
This is the most important curve for cam designers because acceleration is directly proportional to force.
Newton's second law (F = m × a) means that every peak in the acceleration curve
corresponds to a peak force on the valve train components.
How to Read It
- Positive acceleration: The follower is being pushed upward (the cam is actively driving the follower against the spring).
- Negative acceleration: The follower is decelerating or being pulled back. The valve spring must provide the force to keep the follower on the cam during negative acceleration.
- Zero crossings: Points where acceleration changes sign. At these points the velocity is at a maximum or minimum.
Why It Matters
The magnitude of acceleration directly determines:
- Valve spring requirements: The spring must be strong enough to produce more force than the negative acceleration demands, at every RPM the engine will see. If the spring force is insufficient, the follower lifts off the cam — this is called valve float.
- Contact stress: Higher acceleration means higher contact force between the cam and follower, which increases Hertzian contact stress and affects wear life.
- Component loads: Pushrods, rocker arms, and valve stems all carry the force created by acceleration. Higher peaks mean stronger (heavier) parts are needed.
The Relationship: Acceleration → Velocity → Lift
The mathematical relationship flows in both directions:
Going down (differentiation):
    Lift → Velocity → Acceleration → Jerk

Going up (integration):
    Jerk → Acceleration → Velocity → Lift
In Cam Designer, you define the acceleration shape using control points. The software then:
- Integrates acceleration once to compute velocity.
- Integrates velocity once more to compute lift.
- Differentiates acceleration to compute jerk.
This is why the acceleration curve is the starting point — everything else follows from it.
Jerk
What It Is
Jerk is the rate of change of acceleration — the third derivative of lift. It measures how abruptly the forces change. A sudden jump in acceleration produces a spike in jerk.
How to Read It
- Smooth acceleration = low jerk: When the acceleration curve transitions gradually, jerk stays small.
- Sharp acceleration corners = jerk spikes: Any sharp bend or discontinuity in the acceleration curve creates a tall, narrow spike in jerk.
- Infinite jerk = discontinuity: If acceleration has a true corner (a sudden change in slope), the jerk is theoretically infinite at that point. This should be avoided.
Why It Matters
High jerk causes:
- Shock loading: Sudden force changes create stress concentrations and impact loads on bearings, pivots, and contact surfaces.
- Vibration: Abrupt force transitions excite the natural frequencies of the valve train, causing resonance, noise, and potential fatigue failure.
- Noise: Jerk spikes are a primary source of valve train noise.
How the Four Curves Are Connected
The four curves form a chain. Each curve is the slope (rate of change) of the one above it:
| If This Curve Is... | Then the Next Curve Is... |
|---|---|
| Lift is increasing | Velocity is positive |
| Lift is flat (at peak or on base circle) | Velocity is zero |
| Lift is decreasing | Velocity is negative |
| Velocity is increasing | Acceleration is positive |
| Velocity is at its peak | Acceleration is zero (crossing) |
| Velocity is decreasing | Acceleration is negative |
| Acceleration is changing gradually | Jerk is small |
| Acceleration has a sharp corner | Jerk has a spike |
What Makes a Good Cam Profile
A well-designed cam profile balances competing goals: maximum valve opening for airflow versus minimum stress and vibration. Here are practical guidelines:
Smooth Transitions
The acceleration curve should have smooth, rounded transitions between segments. Sharp corners in the acceleration create jerk spikes, which cause noise, vibration, and shock loading. Use lower sharpness values (0.3–0.6) for smoother transitions, or higher values (0.7–0.9) when you need to pack more lift into a given duration.
Controlled Seating Velocity
Watch the velocity curve at the closing ramp (the last part of the fall side, near the base circle). The velocity must be small when the valve contacts the seat. A typical target is less than 0.05 mm/deg for passenger car applications and may be higher for racing applications.
Negative Acceleration vs. Spring Force
The negative acceleration region determines the minimum spring force required. At any given RPM, the spring must exert more force than the inertial load created by negative acceleration. If the spring is too weak, the follower separates from the cam — this is valve float.
Common Problems and What They Look Like
| Symptom | What You See on the Graph | What It Means |
|---|---|---|
| Lift doesn't return to zero | Lift curve ends above or below the baseline | The profile isn't closed. Press Solve or adjust durations. |
| Huge jerk spikes | Jerk curve has very tall, narrow spikes at acceleration transitions | Acceleration corners are too sharp. Reduce sharpness values. |
| Velocity doesn't reach zero at closure | Velocity curve has a non-zero value at the end of the event | The follower would hit the seat at speed. Press Solve to fix. |
| Negative lift values | Lift curve dips below zero | The follower would need to pass through the base circle — physically impossible. Adjust acceleration magnitudes. |
| Flat spot on lift curve | Lift curve has a horizontal section in the middle | Velocity is zero in the middle of the event. Usually caused by acceleration crossing zero in an unintended way. |
Motion Curves Quick Reference
| Curve | Units | What It Tells You | Design Impact |
|---|---|---|---|
| Lift | mm | How far the valve is open | Airflow, engine breathing |
| Velocity | mm/deg | How fast the valve is moving | Seating impact, oil flow |
| Acceleration | mm/deg² | Force on the valve train | Spring requirements, contact stress, component loads |
| Jerk | mm/deg³ | Abruptness of force changes | Vibration, noise, shock loads |
🌬️ Flow Analysis
The Flow Analysis page evaluates how effectively your cam profile opens the valve for airflow. It combines your lift profile, valve geometry, engine dimensions, and optional flow bench data to calculate curtain area, time-area indices, and 720° breathing charts.
Key Concepts
- Curtain area — the cylindrical area around the valve seat through which air flows. This is the primary geometric limit on airflow at any given lift.
- Time-area index — the integral of curtain area over the valve event duration. A higher value means more total flow opportunity.
- Curtain-to-bore ratio (CBR) — peak curtain area divided by bore area. Values above 100% mean the valve opening is not geometrically restricting flow at peak lift.
Two Analysis Tiers
- Tier 1 (Geometry only): Uses valve diameter, seat angle, and lift to compute curtain area. No flow bench data needed — available for every cam design.
- Tier 2 (Flow bench): Adds measured CFM-vs-lift data from a flow bench. This accounts for port, seat, and valve head restrictions that geometry alone cannot predict.
Formulas
Valve curtain area (perpendicular to flow):
  A_curtain = π × D_valve × L × cos(seat_angle)

Total curtain area (all valves of this type):
  A_total = N_valves × A_curtain

Bore area (reference):
  A_bore = π/4 × D_bore²

Geometric time-area index:
  TA = Σ( A_curtain(θ) × Δθ )  over all cam angles where lift > 0

Mean curtain area during event:
  A_mean = TA / duration

Curtain-to-bore ratio at peak lift:
  CBR = A_curtain_peak / A_bore × 100%
The Valve Timing Diagram
The valve timing diagram shows both intake and exhaust lift curves plotted together over a full 720° crank cycle. The horizontal axis spans from 0° to 720° with 0° at TDC overlap (the point where both valves are open between the exhaust and intake strokes). Four background bands show the engine strokes: Intake, Compression, Power, and Exhaust.
This chart lets you visualize overlap (both valves open near TDC), relative event duration, and how each valve event aligns with piston motion. The intake and exhaust centerlines from the sidebar control where each profile is positioned.
Save and Load
The Flow Analysis page has Save and Load buttons that
work the same way as on the Motion Design page — all data stays on your local computer.
Save downloads a .json configuration file containing all sidebar inputs
(valve sizes, engine dimensions, cam timing, and flow bench data). Load restores them.
Valve Train Design
The Valve Train design page allows you to specify different valve train configurations and visualize the cam profile.
Supported Types
- Flat Follower: Simple translating flat-faced followers
- Radiused Follower: Curved followers with specific radius
- OHV Rocker Arm Flat: Overhead valve with flat rocker pads
- OHV Rocker Arm Roller: Overhead valve with roller followers
- Cam Over Rocker Arm: Cam positioned above rocker pivot
- Cam Under Rocker Arm: Cam positioned below rocker pivot
Key Parameters
Each valve train type has specific parameters that define its geometry:
| Parameter | Unit | Description |
|---|---|---|
| Base Circle Radius | mm | Distance from cam center to zero-lift point |
| Follower Radius/Diameter | mm | Size of the follower element |
| Pivot Distances | mm | Rocker arm pivot locations |
Visualization Controls
Once you load a cam profile, you can control how it's visualized:
Cam Rotation
Adjust the rotation angle to see how the follower contacts the cam at different positions.
Reset to 0°- Shows baseline positionSet to 30°- Common analysis pointSet to 180°- Shows opposite side
Follower Width
Adjust the displayed follower width to visualize contact coverage. The distance indicators show how far the contact point is from the follower edges.
Curvature Visualization
Green lines show the radius of curvature at each point:
- Longer lines: Larger radius of curvature (gentler curves)
- Shorter lines: Smaller radius of curvature (sharper curves)
Data Analysis
The Data Table page provides comprehensive analysis of your cam profile:
Available Data
- Angle - Cam rotation angle
- Lift - Height of follower above base circle
- Velocity - Rate of change of lift
- Acceleration - Rate of change of velocity
- Rocker Angle - Rocker arm angle (if applicable)
- Radius of Curvature - Cam profile curvature
- Loads - Forces at idle and peak RPM
- Contact Stress - Contact pressure calculations
Export Options
Export your analysis data in multiple formats:
- CSV: For spreadsheet analysis
- JSON: For programmatic processing
- Print: For documentation
Moment of Inertia Calculator
Calculate the rotational inertia of your valve train assembly:
How It Works
The calculator uses the formula:
I = Σ(m × r²)

Where:
  I = moment of inertia
  m = mass of component
  r = distance from rotation axis
Input Parameters
- Mass of each component (valve, rocker, pushrod, follower)
- Distances from pivot points
- Spring pre-load for dynamic analysis
Troubleshooting
Page Won't Load Data
Check:
- Internet connection is active
- Browser console for error messages (F12)
- Try refreshing the page
Contact Point Goes Outside Follower
Solutions:
- Increase follower width
- Reduce cam lift
- Adjust base circle radius
Unusual Curvature Patterns
This may indicate:
- Sharp transitions in motion definition
- Non-optimal cam profile
- Check your input parameters
Support & Feedback
Have questions or found a bug?
- Contact Us: Use the Contact page to reach the team
- Bug Report: Report issues via the Feedback page
- Feature Request: Suggest improvements on the Feedback page
Documentation Version 1.0 | Last Updated: 2026